Fluentd - Simplified

If you are running your apps in a distributed manner, you are very likely to be using some centralized logging system to keep the their logs. The most widely used data collector for those logs is fluentd. In this post we are going to explain how it works and show you how to tweak it to your needs. We are assuming that there is a basic understanding of docker and linux for this post.
Basic concepts
Have you ever run tail -f myapp.log | grep "what I want" > example.log in bash? Well this is what fluentd does pretty well, tailing logs or receiving data of some form, filtering it or transforming it and then sending it to another place.
That line above can be broken in multiple pieces:
Input
tail -f myapp.log
Here we are tailing a file forever, every time something is added to the file it will be shown in the screen. This is called input plugin in fluentd, tail is one of them, but there are many more.
Filtering
| grep "what I want"
Here we are taking the output from the tail -f and filtering out only lines that contain the string what I want. In fluentd-land this is called a filter plugin.
Output
> example.log
Here we are saving the filtered output from the grep command to a file called example.log. In fluentd this is called output plugin. Besides writing to files fluentd has many plugins to send your logs to other places.
And that's the gist of fluentd, you can read stuff, process it and send it to another place for further analysis. Let's put these concepts into practice with a small demo to see how these 3 plugin types work together.
Demo
For this demo, we will be getting familiar with docker logs and how are they being read by fluentd, by the end of this demo, you will be a fluentd ninja! 😁
Setup
To help you with the setup, I've created this repo, after cloning it you will end up with the following directory structure:
fluentd/
    ├── etc/
    │   └── fluentd.conf
    ├── log/
    │   └── kong.log
    └── output/
In output/ is where fluentd is going to write the files.
In log/kong.log we have some logs from a kong container that I have running in my laptop. Take a look at these logs, they have the docker format:
{
    "log":"2019/07/31 22:19:52 [notice] 1#0: start worker process 32\n",
    "stream":"stderr",
    "time":"2019-07-31T22:19:52.3754634Z"
}
Every line of that file is a single json document, this is how docker logs are with the default driver. We will be tailing and parsing this file, it has application logs mixed with access logs. Our goal here is to get only the access logs.
etc/fluentd.conf is our fluentd configuration, take a look at it, you can see that there's an input and an output section, we will be takin a closer look to it later, first let's run the fluentd container:
Running fluentd
docker run -ti --rm \
-v $(pwd)/etc:/fluentd/etc \
-v $(pwd)/log:/var/log/ \
-v $(pwd)/output:/output \
fluent/fluentd:v1.10-debian-1 -c /fluentd/etc/fluentd.conf -v
Pay attention to that run command and the volumes we are mounting:
etc/is mounted onto the/fluentd/etc/directory inside of the container to override fluentd default config.log/onto/var/log/ending up with/var/log/kong.loginside of the container.output/onto/outputto be able to see what fluentd writes to disk.
After running the container you should see a line like:
2020-05-10 17:33:36 +0000 [info]: #0 fluent/log.rb:327:info: fluentd worker is now running worker=0
This means that fluentd is up and running.
Now that we know how everything is wired and fluentd is running, let's see the config file in detail and start exploring what fluentd is doing with it:
Fluentd config
First we have the input section
<source>
  @type tail
  path "/var/log/*.log"
  tag "ninja.*"
  read_from_head true
  <parse>
    @type "json"
    time_format "%Y-%m-%dT%H:%M:%S.%NZ"
    time_type string
  </parse>
</source>
Let's take a closer look to some of that config:
@type tail: is the type of input we want, this is very similar totail -fpath "/var/log/*.log": This means that it willtailany file ending with.log, each file will generate its own tag like:var.log.kong.logtag "ninja.*": This is going to prependninja.to every tag created by this source, in this case we have only one file ending up withninja.var.log.kong.logread_from_head true: To consume the whole file instead of only new lines.<parse>section: Since every line of the docker logs is a json object, we are going to parse as json.
Then we have the output section:
<match **>
  @type file
  path /output/example.log
  <buffer>
    timekey 1d
    timekey_use_utc true
    timekey_wait 1m
  </buffer>
</match>
There are 2 important bits in this config:
<match **>: This means that we are going to match any tag in fluentd, we only have one so far, the one created by the input plugin.path /output/example: This is the name of the directory where buffers are kept and the beginning of every log file, ending up with this:
    ├── example
    │   ├── buffer.b5a579308a9becefb07a20821ea3ab218.log
    │   └── buffer.b5a579308a9becefb07a20821ea3ab218.log.meta
    ├── example.20190731.log
    └── example.20200510.log
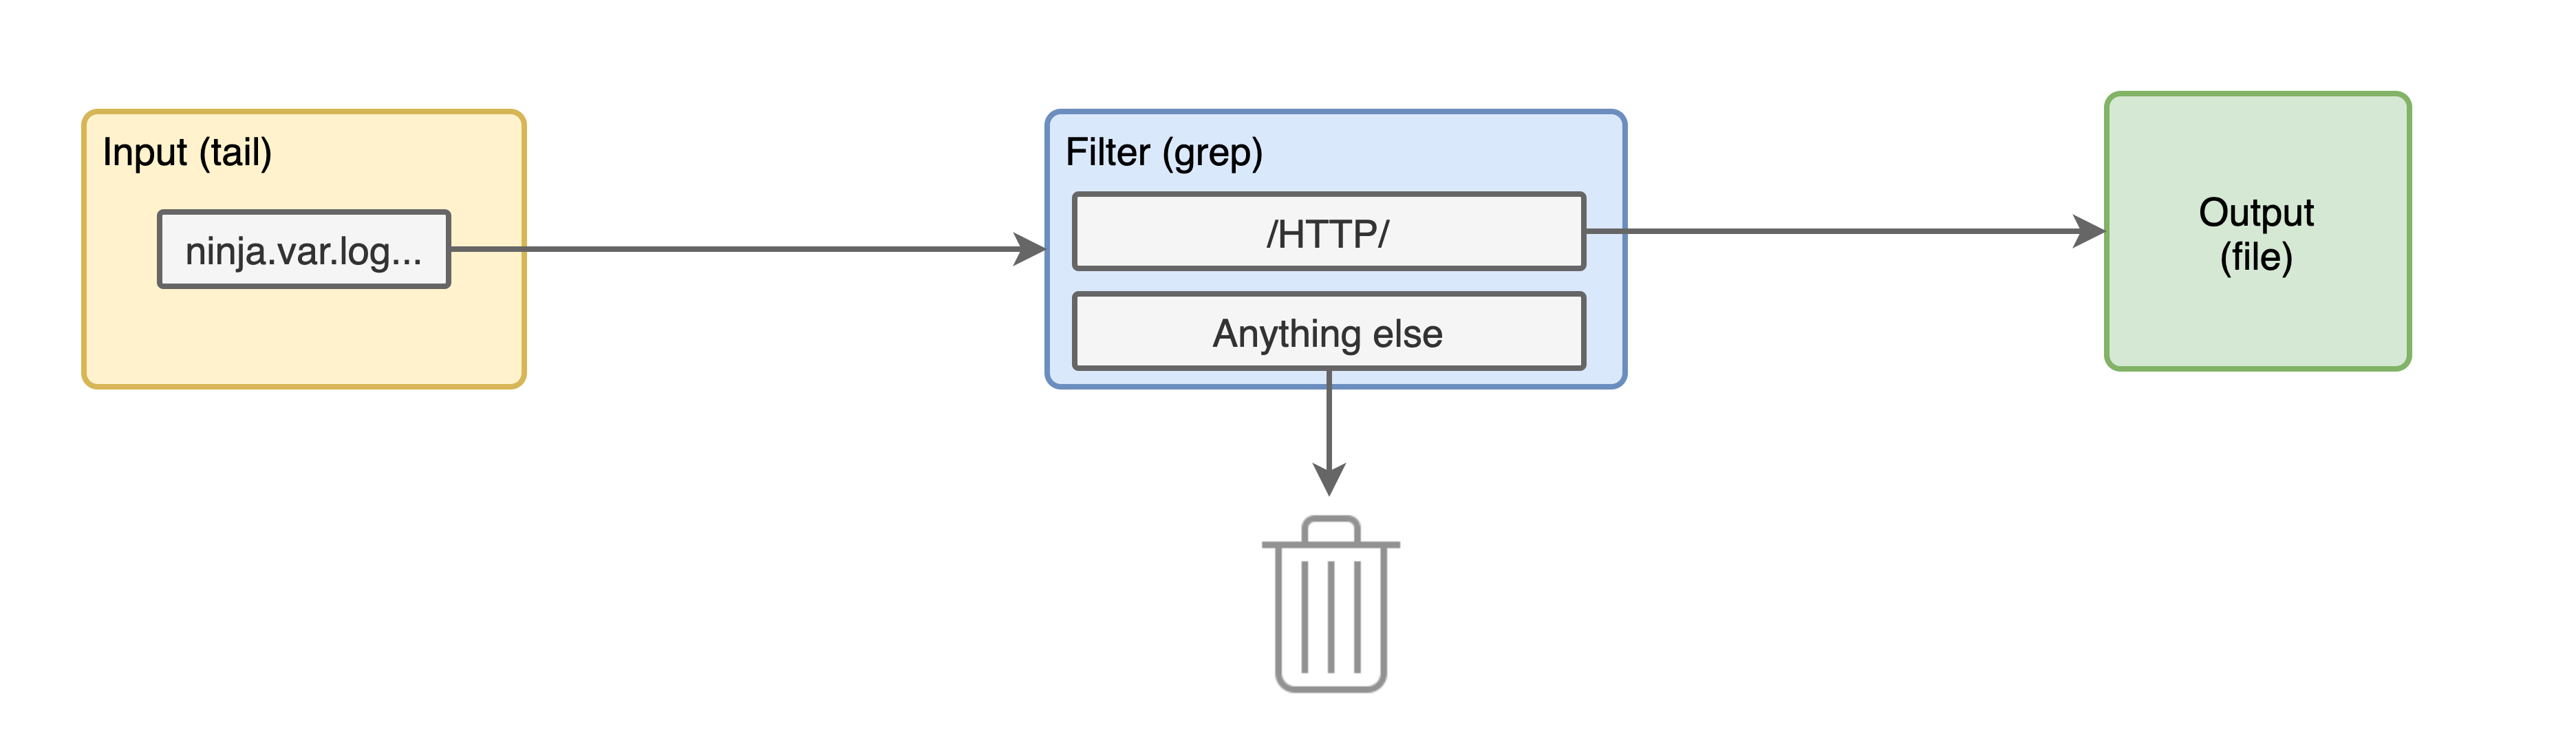
With this configuration we have a very simple input/output pipeline like so:

Now, let's see some logs from one of the files that fluentd has created example.20200510.log:
2020-05-10T17:04:17+00:00	ninja.var.log.kong.log	{"log":"2020/05/10 17:04:16 [warn] 35#0: *4 [lua] globalpatches.lua:47: sleep(): executing a blocking 'sleep' (0.004 seconds), context: init_worker_by_lua*\n","stream":"stderr"}
2020-05-10T17:04:17+00:00	ninja.var.log.kong.log	{"log":"2020/05/10 17:04:16 [warn] 33#0: *2 [lua] globalpatches.lua:47: sleep(): executing a blocking 'sleep' (0.008 seconds), context: init_worker_by_lua*\n","stream":"stderr"}
2020-05-10T17:04:17+00:00	ninja.var.log.kong.log	{"log":"2020/05/10 17:04:17 [warn] 32#0: *1 [lua] mesh.lua:86: init(): no cluster_ca in declarative configuration: cannot use node in mesh mode, context: init_worker_by_lua*\n","stream":"stderr"}
2020-05-10T17:04:30+00:00	ninja.var.log.kong.log	{"log":"172.17.0.1 - - [10/May/2020:17:04:30 +0000] \"GET / HTTP/1.1\" 404 48 \"-\" \"curl/7.59.0\"\n","stream":"stdout"}
2020-05-10T17:05:38+00:00	ninja.var.log.kong.log	{"log":"172.17.0.1 - - [10/May/2020:17:05:38 +0000] \"GET /users HTTP/1.1\" 401 26 \"-\" \"curl/7.59.0\"\n","stream":"stdout"}
2020-05-10T17:06:24+00:00	ninja.var.log.kong.log	{"log":"172.17.0.1 - - [10/May/2020:17:06:24 +0000] \"GET /users HTTP/1.1\" 499 0 \"-\" \"curl/7.59.0\"\n","stream":"stdout"}
Pay attention to it, there are 3 columns in each line:
<time of the log> <tag of the log> <the content of the log>
Note: Check that the tag has the “ninja” string plus the directory path and the file name, all separated by “.”
Filtering the logs
Now that we have our logs working in fluentd, let's apply some filtering to it.
So far we have implemented 2 sections of that previous command working fine, the tail -f /var/log/*.log and the > example.log, but if you take a look at the output, we have access logs mixed with application logs, now we need to implement the grep 'what I want' filter.
For this example we want only the access logs and we will discard all the other lines, please note that you should always keep all your logs, including the application logs, this is just for demonstration.
Let's say that grepping by HTTP will give us all the access logs and will exclude the application logs, this configuration will do that:
<filter ninja.var.log.kong**>
  @type grep
  <regexp>
    key log
    pattern /HTTP/
  </regexp>
</filter>
Let's take a look at this config:
<filter ninja.var.log.kong**>: We will filter only tags starting withninja.var.log.kong.@type grep: The plugin type we are going to use, this is exactly like grep<regexp>section: Here we are grepping “HTTP” in thelogkey of the log content
With this configuration we have added a new block in our pipeline like so:
Let's stop and run the container again.
Now you should see something different in the output logs, there are no application logs, we have only access logs:
2020-05-10T17:04:30+00:00	ninja.var.log.kong.log	{"log":"172.17.0.1 - - [10/May/2020:17:04:30 +0000] \"GET / HTTP/1.1\" 404 48 \"-\" \"curl/7.59.0\"\n","stream":"stdout"}
2020-05-10T17:05:38+00:00	ninja.var.log.kong.log	{"log":"172.17.0.1 - - [10/May/2020:17:05:38 +0000] \"GET /users HTTP/1.1\" 401 26 \"-\" \"curl/7.59.0\"\n","stream":"stdout"}
2020-05-10T17:06:24+00:00	ninja.var.log.kong.log	{"log":"172.17.0.1 - - [10/May/2020:17:06:24 +0000] \"GET /users HTTP/1.1\" 499 0 \"-\" \"curl/7.59.0\"\n","strea
Parsing Access Logs
Just to practice, let's add a parser plugin to extract useful information from the access logs.
Use this config after the grep filter:
<filter ninja.var.log.kong** >
  @type parser
  key_name log
  <parse>
    @type nginx
  </parse>
</filter>
Let's review that config:
<filter ninja.var.log.kong**>: We will parse any tags starting withninja.var.log.kongsame as before- The type of filter is
parser - We are going to parse the
logkey of the log content - Since those are nginx access logs, we are going to use the parser
@type nginx
This is how our pipeline is looking now:
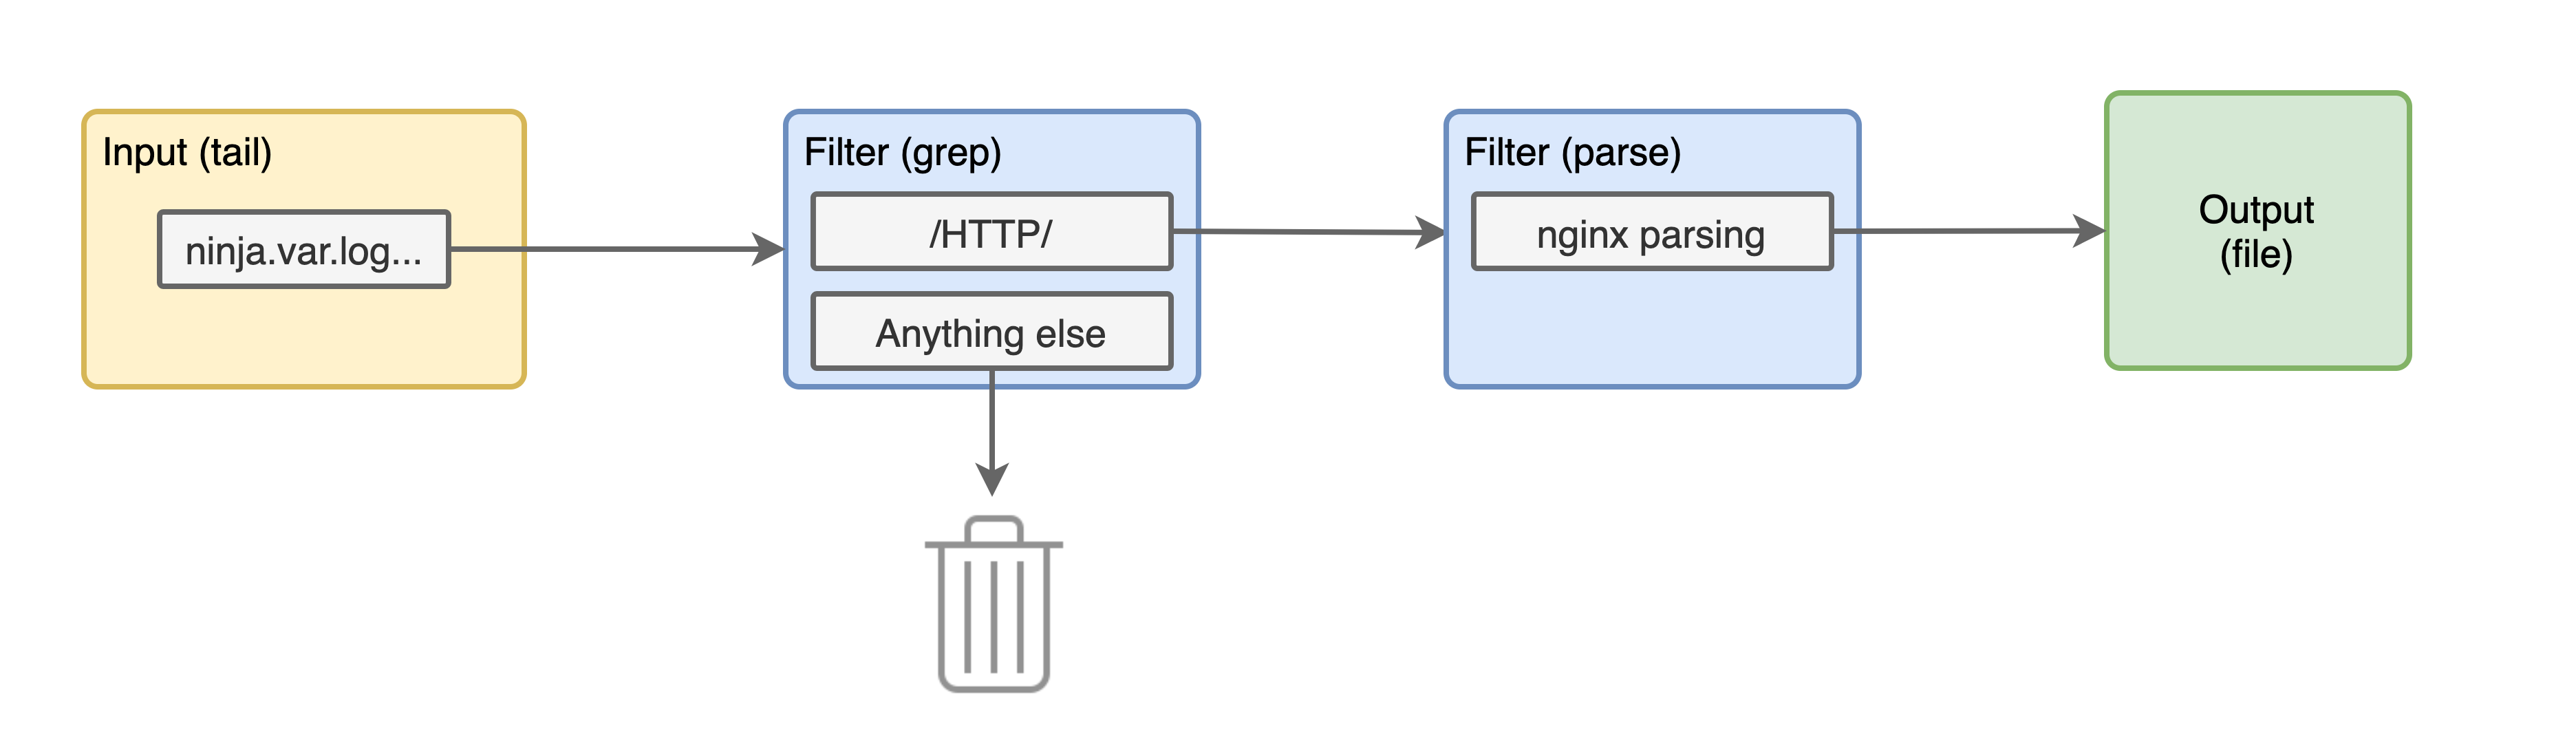
Let's run that docker command again and see the logs. The Kong access logs should be looking like this:
2020-05-10T17:04:30+00:00 ninja.var.log.kong.log {"remote":"172.17.0.1","host":"-","user":"-","method":"GET","path":"/","code":"404","size":"48","referer":"-","agent":"curl/7.59.0","http_x_forwarded_for":""}
That is the first access log from the previous logs, now the log content is completely different, our keys have changed from log and stream, to remote, host, user, method, path, code, size, referer, agent and http_x_forwarded_for. If we were to inject this into elasticsearch we will be able to filter by method=GET or any other combination.
You can go even further and apply geoip to the remote field to extract the countries of the IPs hitting our API, but I'll leave that to you, cause you are now a fluentd ninja.
Recap
Now we know how to setup fluentd with docker to read any file, we can identify the different sections in the configuration, we were able to translate a linux command to it and finally we were able to see a glimpse of parsing some logs to extract useful information from it.
I hope you were able to follow through with me on fluentd and it has become a simpler tool to use. Enjoy logging!